
Is Evolution AB undervalued? Find out with this FREE valuation tool
Improving your DCF calculation using Monte Carlo simulations

As a value investor, the Discounted Cash Flow (DCF) model should be your bread and butter. If you don’t know what a DCF is, what are you even doing here? (Just kidding - I’ll explain it briefly below).
However, if you have built a DCF, you know the dirty secret of the trade: it is mostly assumptions.
You input a 5% growth rate. You assume a 10% required return rate (WACC). You input the base cash flow, tweak the terminal value, and voilà! You see a potential 50% upside. You think, “Wow… How is the market not seeing this? I’ll put all my money on this!”
But we know that 5% growth is not a fact; it is an assumption. It might be -5%, it might be 15%. The return rate should be adjusted to interest rates. Blah blah blah…
The most important point here: a set of single, static assumed numbers for DCF might make you lose sight of the risk.
We need to stop valuing companies with single numbers and start valuing them as a range of probabilities. After all, it is better to be roughly right than precisely wrong.
Enter: Monte Carlo Simulation
This is where Monte Carlo simulations come in. Instead of running your DCF once, we run it thousands of times. In each iteration, the model picks a random growth rate and a random discount rate from a range you define (a “probability distribution”). Some scenarios are great, some are terrible, and most are somewhere in the middle.
The result gives you a probability: “There is an 80% chance this stock is worth between $100 and $120.”
The Free Tool
I did not want to just write about this. I wanted to give you a way to use it. I have built a custom Monte Carlo analysis tool for you to access below, followed by a real-world analysis on Evolution AB.
NOTE: The tool is hosted on a free service and may take a minute to wake up. Please be patient. It might not be suitable for mobile phone.
Subscribe for faster load and mobile version in the future. More free tools to come!
How to use the tool
Once you land on the home page, click on Open Valuation Models. You can then manually input your numbers on the sidebar. Whether you are a DCF pro or a complete beginner, you can read some guidelines below.
NOTE: The tool is currency/unit agnostic! Be careful and make sure that you are putting them in the correct units. If your base cash flow is in millions, ensure that your shares outstanding is also in millions.
Base Cash Flow This is the starting point. You can use Free Cash Flow, Owner’s Earnings, Net Earnings or other numbers you prefer.
Tip: Be careful here. If the company is cyclical (like shipping or commodities), use cycle-normalized numbers. Remove one-off effects that falsely balloon or depress the numbers.
Net Debt You can find this in the most recent financial report (Total Debt minus Cash).
Tip: If the company has heavy lease liabilities (like a retailer with physical stores), consider excluding lease-related liabilities if you are using a cash flow metric that has already paid for those leases.
Number of Shares Outstanding Found in the financial report. This is needed to calculate the value per share.
Growth & WACC Here is where the magic happens. Instead of a single number, you provide an Average (what you expect) and a Standard Deviation (how unsure you are).
Growth: If you think a company will grow at 5% but it’s volatile, give it a higher Standard Deviation (e.g., 5%). This tells the model: “I am somewhat sure the company will grow 5%, but the actual growth may deviate roughly in the 0-10% range.”
WACC (Discount Rate): I view this as my required rate of return. I typically use 10% with a +/- 2% Standard Deviation.
The tool allow you to forecast growth up to the 10th year.
The Terminal Value This is the value of the company after your forecast period.
Perpetual Growth: Assumes the company grows at a steady rate forever. Best for slow, mature companies.
Exit Multiple: Assumes the company is sold for a multiple of its earnings (like P/E ratio). Best for growing companies.
Let’s go to a real world example now.
Real-world example: Evolution AB
(numbers taken as of 3 February 2026)
Let’s look at Evolution AB, the live casino giant. It might be the most confusing stock in the Nordics right now. The stock trades at historic low P/E of ~9x - despite operating margins above 60%. The market is terrified and asking: Will growth slow down? Will regulators clamp down?
A traditional DCF requires you to pick a side: 20% growth (Bull case) or 0% growth (Bear). But the reality is likely somewhere in between.
I ran Evolution through the simulator above using these inputs:
Base Cash Flow: 13 billion SEK (approximate TTM Free Cash Flow)
Net Debt: -6.28 billion (net cash position)
Shares outstanding: 0.206 billion (206 million)
Growth: Average of 5% (historically low), and a high Standard Deviation (+/- 5%). This tells the model: “It could be 5%, but it could also be 0% or 10%.” I projected the same growth for 5 years.
WACC (or required rate of return): 10% (average) with a 2% Standard Deviation.
Terminal value: Exit Multiple of 15x.
Interpreting the Results
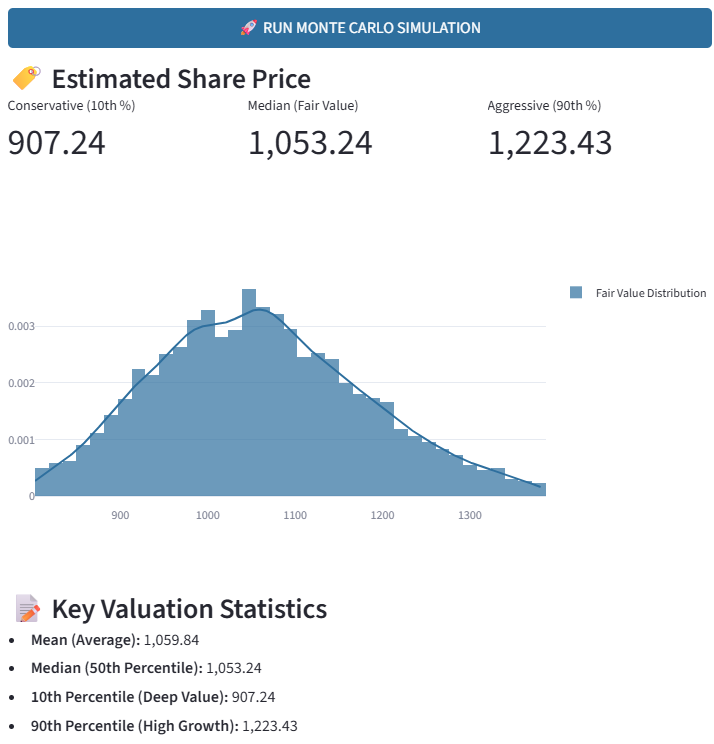
The result of this analysis is the figure shown above. Let’s try to interpret the result relative to the current share price of 563.4 SEK.
The Peak (Most Likely): The highest point of the curve is the most probable intrinsic value.
The Spread (Risk): A wide curve means high uncertainty. A narrow curve means stability. The spread shows that there is an 80% probability that the intrinsic value is between 907 and 1,223 SEK.
The Floor (Downside Protection): In my simulation, in 90% of scenarios, the fair value remained above 907 SEK.
Remember! These results are based on assumptions that I put in.
The verdict?
The model suggests that at 563.4 SEK, the market is pricing Evolution so low that it is below our 10% probability curve. The odds—mathematically speaking—are heavily skewed in the investor’s favor.
Does that mean we should buy Evolution AB? No!
The intrinsic value is just one component of an investment thesis. We need to research other factors:
Do I understand the business risks (e.g. regulation) ?
Do I trust the management?
Is the balance sheet actually healthy and free of potential fraud?
For example, one may use a 20% average WACC and standard deviation of +/- 5% - or an exit multiple of 10x - to take into account the regulatory risk of Evolution AB.
That’s it for now. Go ahead, plug your own numbers and let me know what you find.
I hope you enjoy using the tool and I appreciate any feedback.
Valuation is art and science.
The math is the science; admitting we do not know the exact future is the art.
Disclaimer: I am not a licensed financial advisor. I may hold positions in the securities discussed. The content provided in “The Northside” is for informational and educational purposes only and represents the personal opinions of the author. It is not intended to be, and does not constitute, financial, investment, legal, or tax advice. Investing involves risk, mostly the risk of losing money because you listened to a stranger on the internet. Do your own due diligence.
